Conceptual & Visual Understanding of Hydraulic Head & Groundwater Flow — Andrew J.B. Cohen and John A. Cherry. The Groundwater Project. Free download from gw-project.org. ©The Authors.
5 Saturated Steady Flow at the Field Scale
On a field scale, hydraulic head can be measured using various types of wells (either installed separately, in a spatially clustered arrangement, or at the same horizontal location but at varying depths). Groundwater wells are essentially large-scale versions of the laboratory-scale piezometers used to illustrate Darcy’s law in preceding sections. The following presents the relationship of hydraulic head and flow in three basic formation types (confined aquifer, aquitard, unconfined aquifer) in the saturated zone, and Figure 19 provides a schematic overview.
A confined aquifer is bounded above and below by an aquitard, a semi-pervious formation that restricts flow between overlying and/or underlying aquifers. Interpolation of water levels measured in wells screened in a confined aquifer defines the potentiometric surface.
An unconfined aquifer is bounded only at its base by an aquitard. The top of the unconfined aquifer is the water table, which equals the observed water level in a screened well just deep enough to encounter standing water.
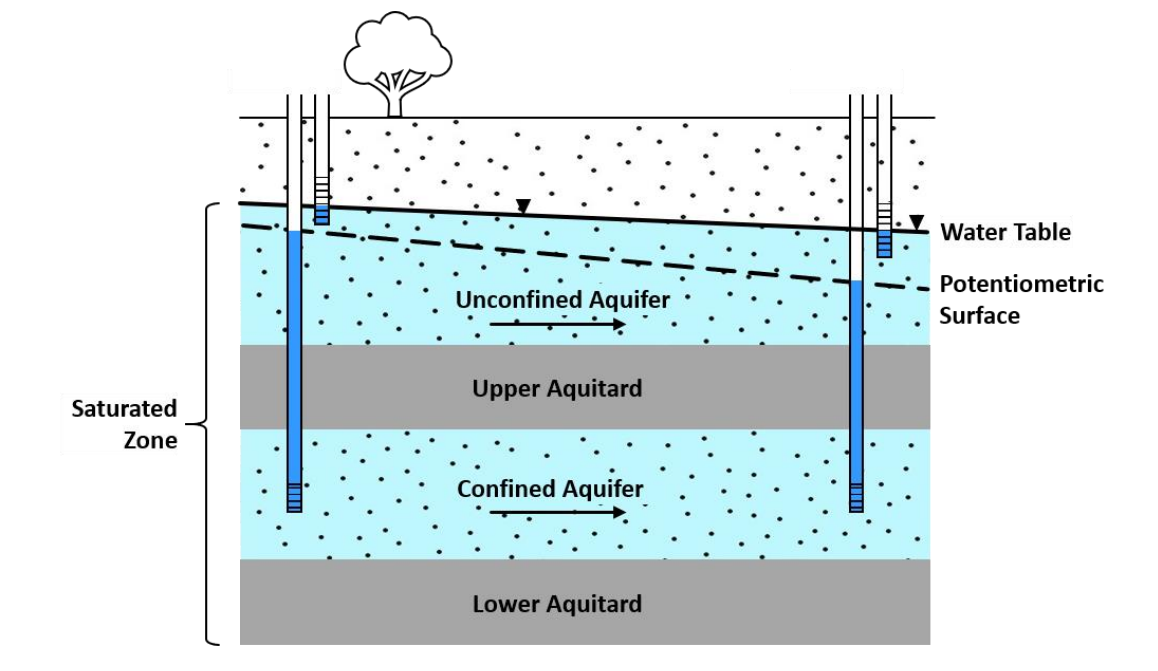
Figure 19 — Schematic cross section of an unconfined and a confined aquifer separated by an aquitard. All units are saturated and therefore hydraulically connected (Cohen and Cherry, 2020).
5.1 Hydraulics of Flow in Confined Aquifers
The experimental setups used to illustrate head and flow resemble conditions in a confined aquifer, because low-K confining layers bound it. When those layers have much lower hydraulic conductivity than the aquifer, they behave nearly as no-flow boundaries (as in the earlier experiments), although under most natural conditions some cross-flow through aquitards can still occur where gradients exist (Darcy’s law).
Central to confined systems is the potentiometric surface, an imaginary surface (Figure 20a) represented with equipotential contours in plan view (Figure 20b) and as a line in cross section (Figure 20c). Section 5.3 discusses aquitard effects in more detail.
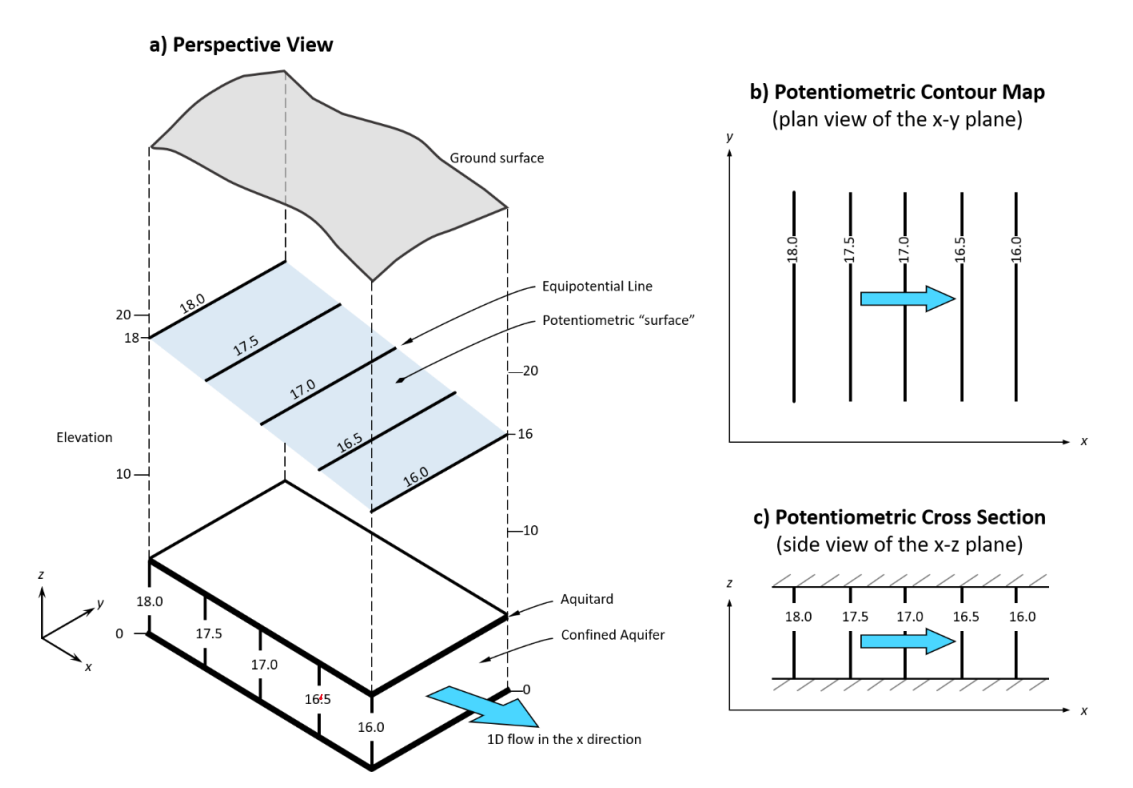
Figure 20 — Potentiometric surface of a confined aquifer: a) perspective, b) plan (equipotential lines), c) cross section. Plan-view equipotentials are analogous to topographic contours for ground surface elevation (Cohen and Cherry, 2020).
Interactive Aquifer Diagram
Adjust the parameters (or use Manual mode). The diagram reacts in real time; on the right you will see formulas and results.
Formulas & Results
Δhwt = hL − hR = — m
iwt = Δhwt / ΔL = — (m/m)
Δhps = hL − hR = — m
ips = Δhps / ΔL = — (m/m)
Q = K · ips · A
Q = — m³/s (K=— m/s, A=— m²)