5.3 Aquifers and Aquitards
Like Exercise 11, this system consists of an upper unconfined aquifer, a clay aquitard, and a lower confined aquifer. However, the key difference lies in the flow direction through the aquitard. As seen in Figure 27b, when the potentiometric surface of the confined aquifer lies above the water table, flow through the clay is upward — this represents a discharge area where the confined aquifer contributes water to the upper unconfined aquifer.
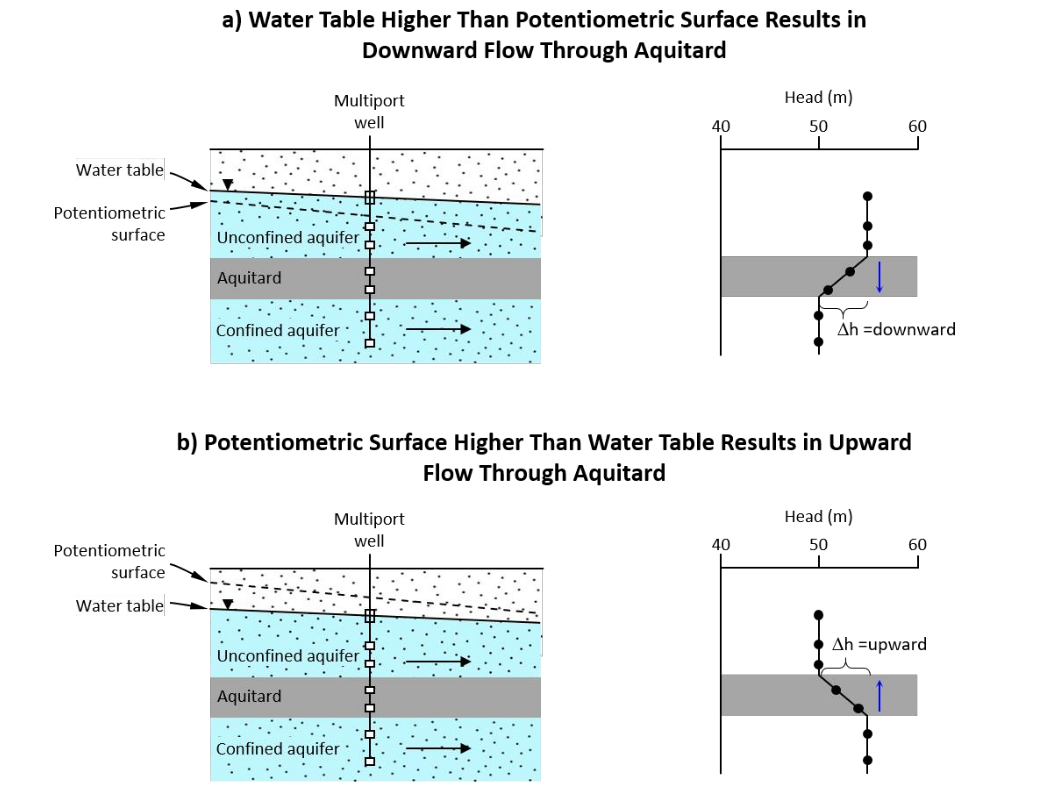 Figure 27 – Head profile across aquitards resulting in: a) downward and b) upward flow. Compare (a) with Exercise 11 and (b) with this exercise (Cohen and Cherry, 2020).
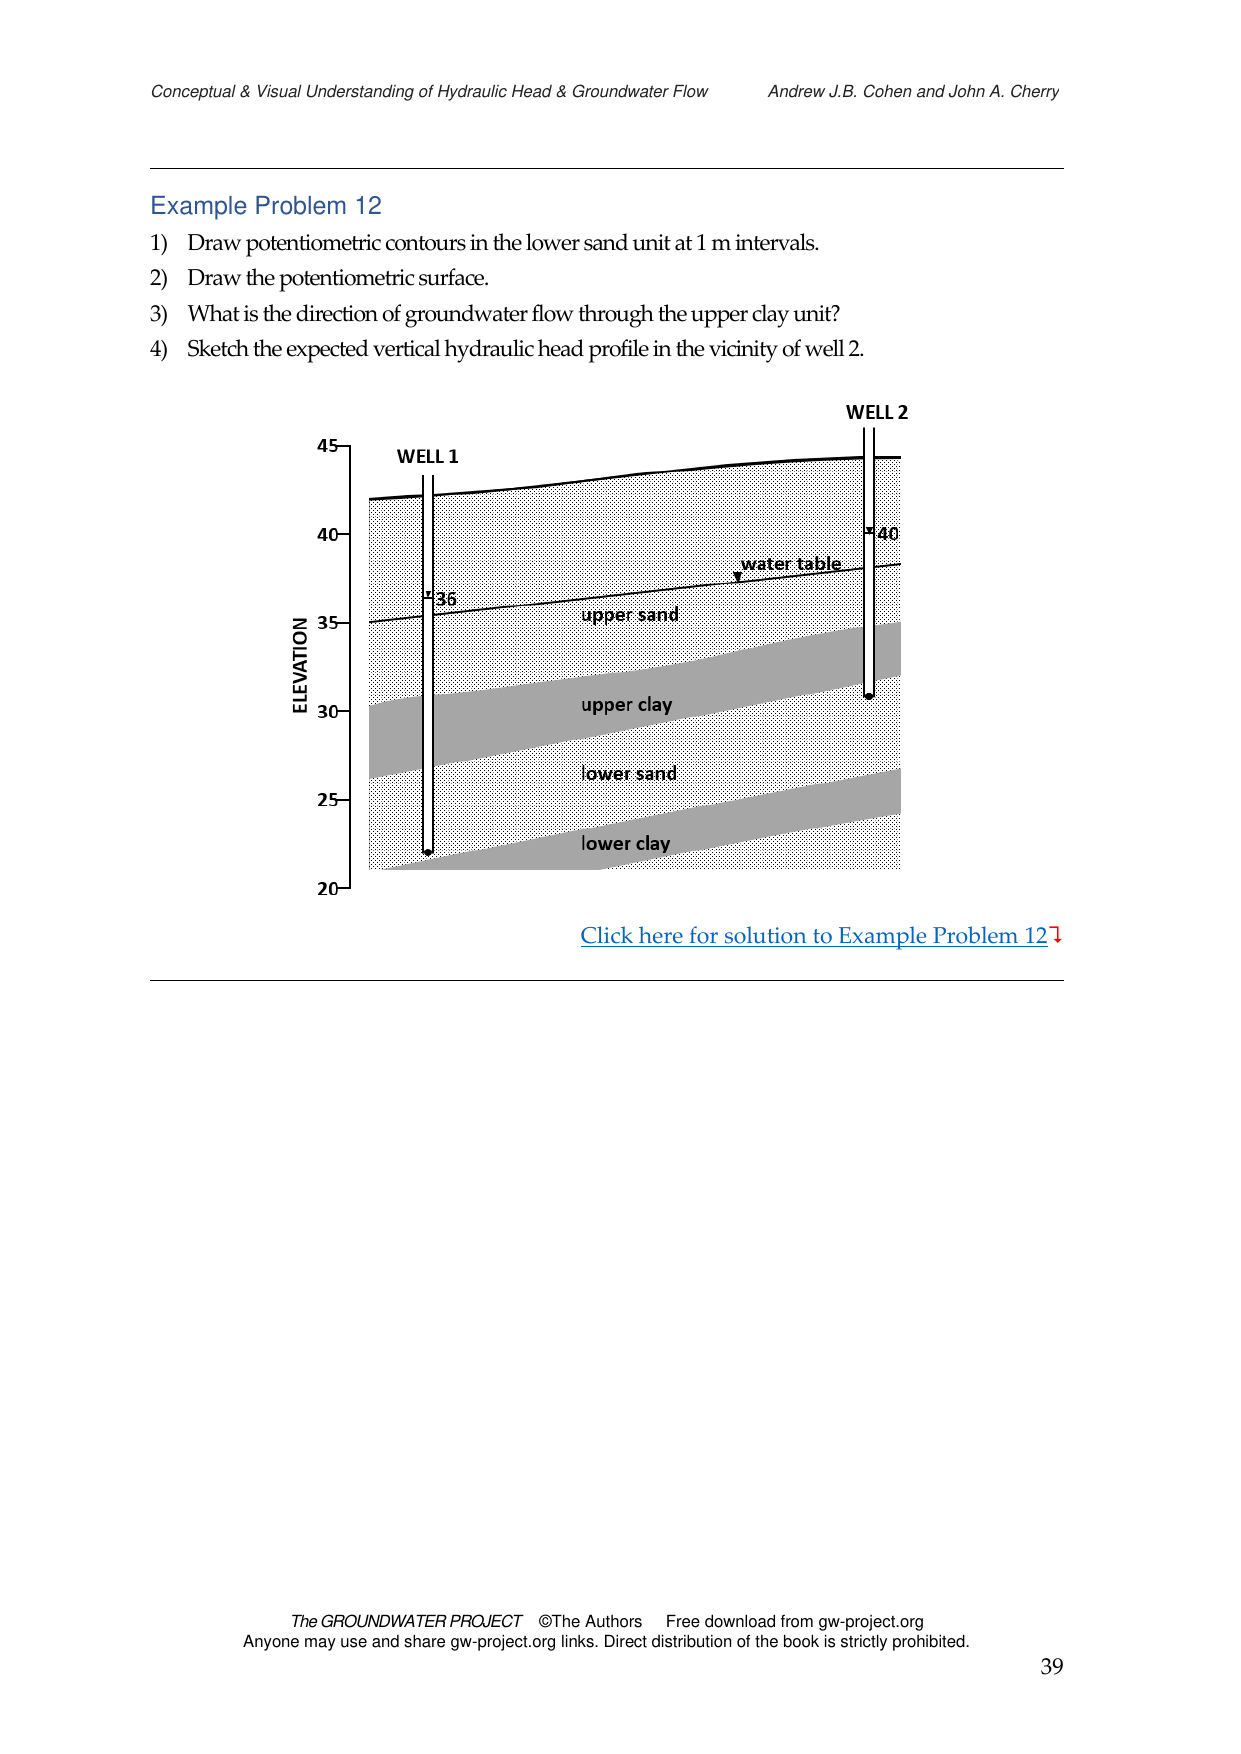
Example Problem 12
This exercise integrates several key concepts about hydraulic head and groundwater flow in a system with an unconfined aquifer, a confined aquifer, and an aquitard separating them. The cross-section shows an upper sand unit, an upper clay aquitard, a lower sand unit, and a lower clay unit, with two monitoring wells.
Before starting, recall these principles:
Potentiometric contours connect points of equal hydraulic head. In a homogeneous, isotropic aquifer with predominantly horizontal flow, they are approximately vertical lines.
The potentiometric surface is the imaginary surface representing the level to which water would rise in a well open to the confined aquifer at any point.
Flow through an aquitard is vertical (either upward or downward), determined by comparing the head above vs. below the aquitard.
Darcy’s law applies even through low-K aquitards: any hydraulic gradient produces some flow.
Interactive exercise
Exercise 12: Groundwater Flow and Hydraulic Head
Use the canvas to sketch your answers before revealing each solution.
Parts A and B — Equipotential Contours and Potentiometric Surface
A) Draw the equipotential contours in the lower sand at 1 m intervals.
B) Draw the potentiometric surface (line connecting the water levels in the wells of the confined aquifer).
Conceptual hint
Part A: Equipotential lines connect points of equal hydraulic head. In a homogeneous, isotropic aquifer with predominantly horizontal flow, equipotential contours are approximately vertical lines. Linearly interpolate between the known head values at the wells (36 m and 40 m).
Part B: The potentiometric surface is the imaginary surface that would represent the level to which water would rise in an open well at any point in the confined aquifer. In cross-section with two wells, it is a straight line connecting the head elevations.
Draw on the canvas and then reveal the solution
Show solution
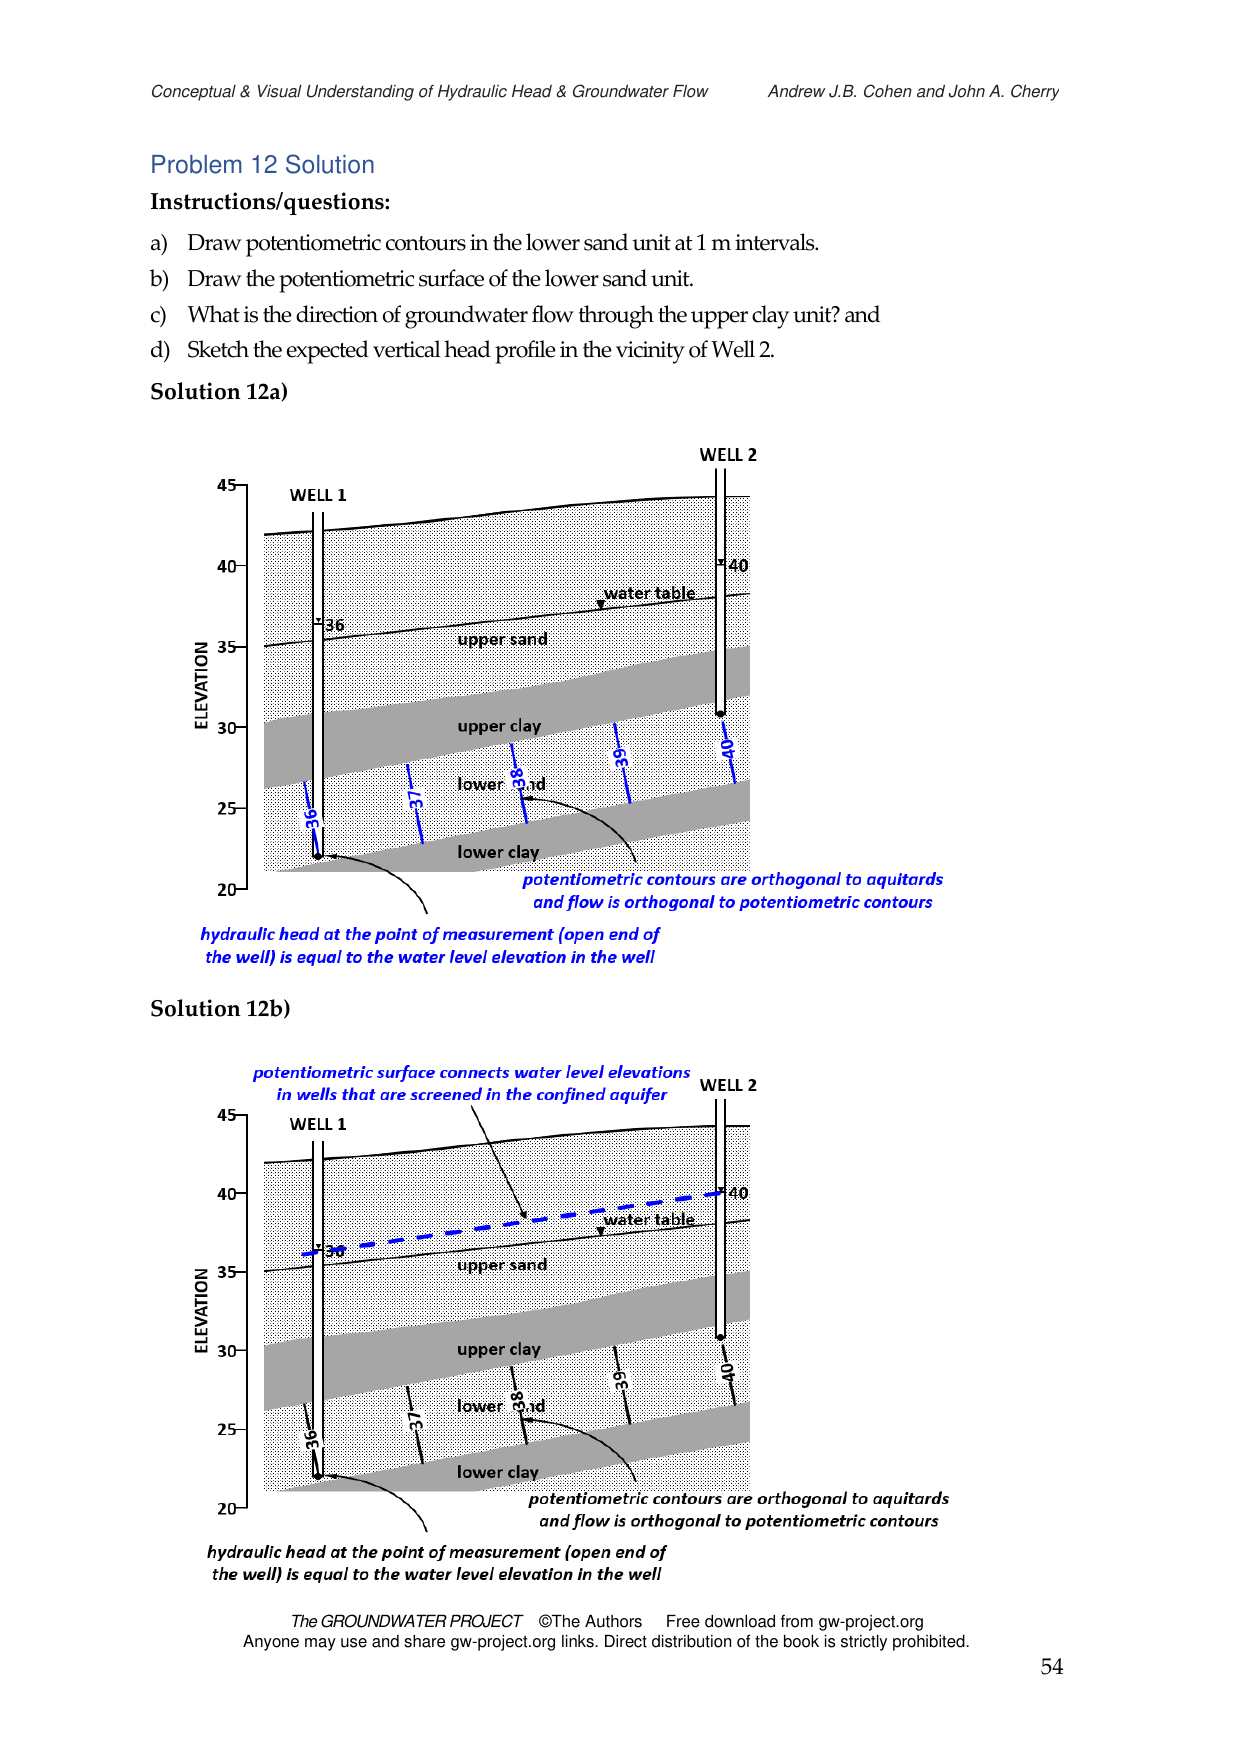
Problem 12 Solution
The step-by-step solution can be explored in the interactive exercise above. Key takeaways:
Potentiometric contours (Part a) in the lower sand unit are evenly spaced vertical lines based on linear interpolation of head values between the wells — head increases from left (36 m at Well 1) to right (40 m at Well 2), so contours are labeled 36, 37, 38, 39, 40 m from left to right. In isotropic media, flow is orthogonal to equipotential lines, confirming predominantly horizontal flow in the confined aquifer.
The potentiometric surface (Part b) is a planar surface (a straight line in cross-section) connecting the head elevations of the two wells screened in the lower confined aquifer (36 m at Well 1, 40 m at Well 2). This surface lies above the water table at Well 2 (where head = 40 m > ~38 m water table), indicating upward flow through the aquitard.
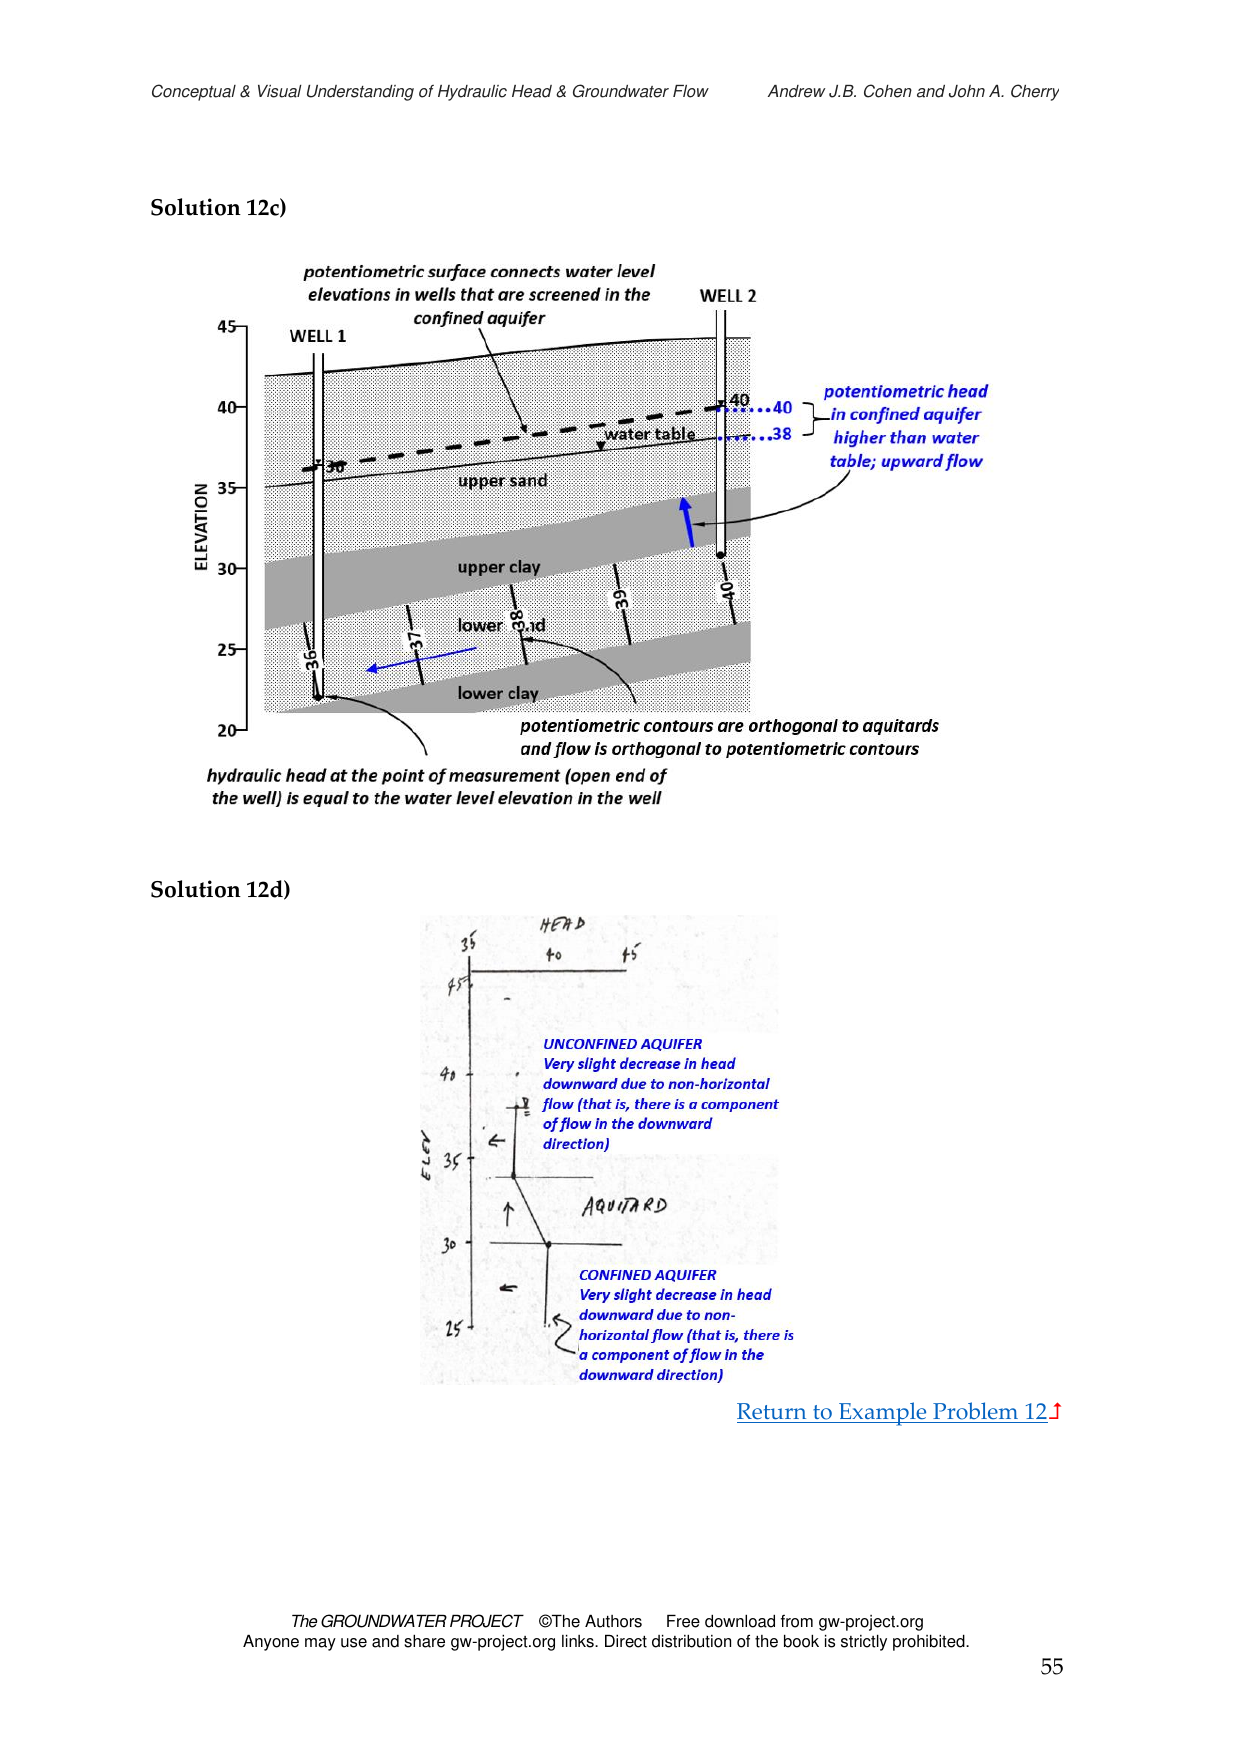
The flow direction through the upper clay unit (Part c) is upward. The potentiometric head in the lower sand at Well 2 is 40 m, which is higher than the water table at that location (~38 m). Since water flows from higher to lower hydraulic head, flow through the aquitard is directed upward. This is an example of a discharge area where the confined aquifer contributes water to the unconfined aquifer.
The expected vertical head profile (Part d) near Well 2 shows: (1) a slight downward decrease in head through the unconfined aquifer (due to a non-horizontal, upward-flow component), (2) a sharp upward jump across the clay aquitard (because head must increase from ~38 m above to 40 m below — flow is upward through the low-K unit), and (3) nearly constant head in the lower confined aquifer (where flow is predominantly horizontal). The head profile across the aquitard is a clear indicator of vertical leakage.
Conceptual Connections
Compare this exercise with Exercise 11, where flow through the aquitard is downward. The direction is reversed because in Ex. 11 the water table is higher than the potentiometric surface, while here it is lower.
The sharp change in head across the aquitard (Part d) is a direct consequence of Darcy’s law: the very low hydraulic conductivity of the clay requires a large hydraulic gradient to transmit even a small amount of flow.
In both Exercise 11 and 12, the potentiometric surface and equipotential contours are determined by the same principles — they differ only in the specific head values and resulting flow directions.