5.3 Aquifers and Aquitards
The flow and associated hydraulic gradient scenarios shown in the previous figures are also present in aquifers separated by an aquitard. As shown in Figure 26, the horizontal gradient in the unconfined aquifer and confined aquifer are defined by the water table and potentiometric surface, respectively. Head decreases towards the right in both aquifers. However, there is a difference in hydraulic head above and below the aquitard.
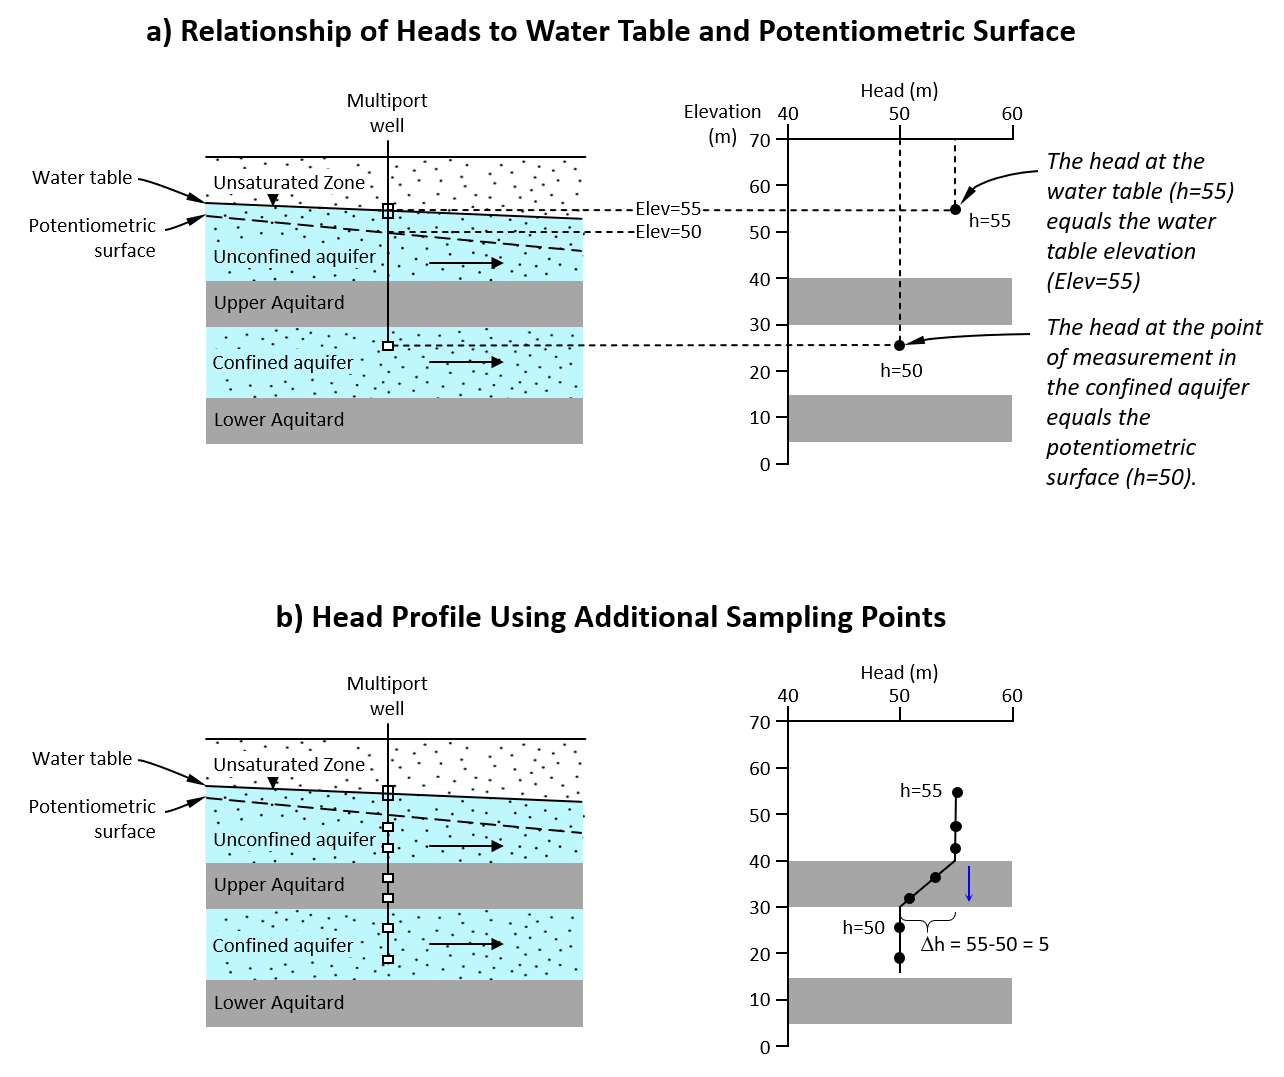 Figure 26 – Example of horizontal flow and associated vertical head profile in: a) an unconfined and b) a confined aquifer, and the associated vertical gradient in an aquitard (Cohen and Cherry, 2020).
There is a distinct change in hydraulic head across the aquitard, which is indicative of a zone of lower hydraulic conductivity. Although most of the flow in the aquifers is horizontal, a fraction flows through the aquitard (from higher head to lower head). It is important to note that a vertical gradient does not necessarily mean that the flow through the aquitard is vertical — rather, it indicates a vertical component of flow. If the presence of a lower-K interval was not known, the hydraulic heads could be misinterpreted as an indication of vertical flow throughout the entire saturated zone. This exemplifies the need to account for known or potential geologic features when interpreting head data.
Figure 27 shows that the direction of flow in the aquitard is dependent on the relative elevations of the water table and potentiometric surface.
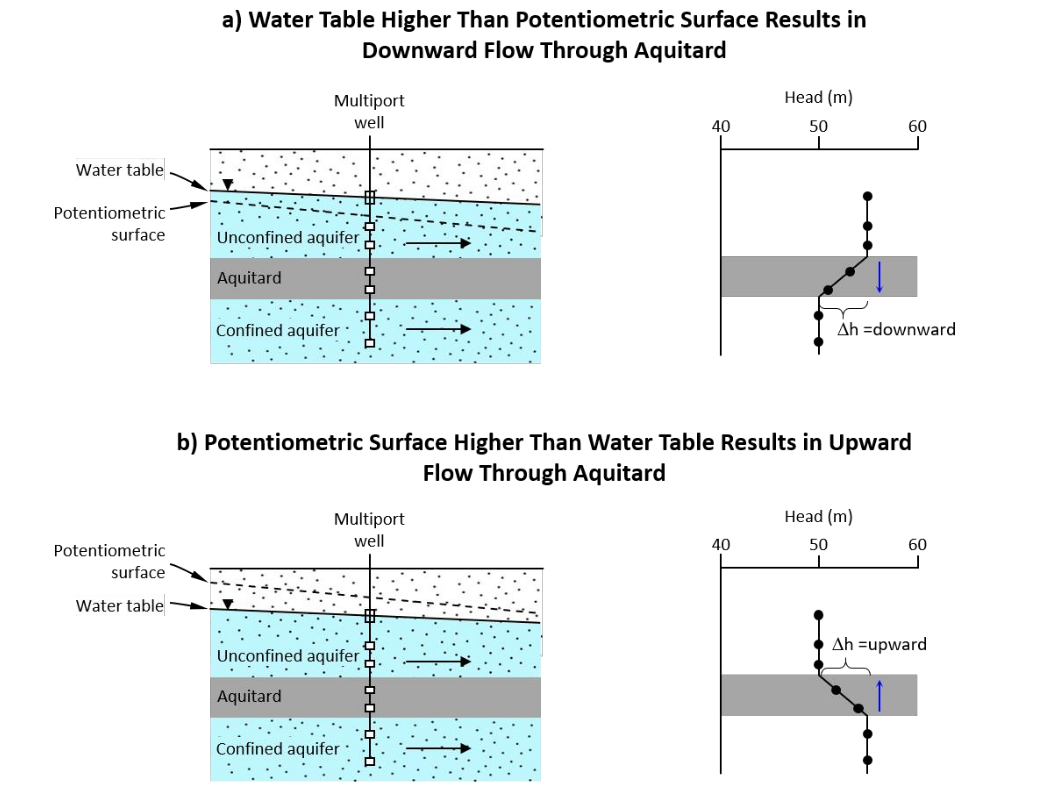 Figure 27 – Head profile across aquitards resulting in: a) downward and b) upward flow (Cohen and Cherry, 2020).
An aquitard is a semi-pervious formation that restricts flow between the overlying and/or underlying aquifers. In some cases, the hydraulic conductivity of the aquitard is less restrictive, and some groundwater may flow between the aquifers (leaky aquitard). In either case, groundwater is present and fully saturates the aquitard, so some hydraulic connection between the aquifers exists. Accordingly, there is a hydraulic gradient in the aquitard, as shown in Figure 28.
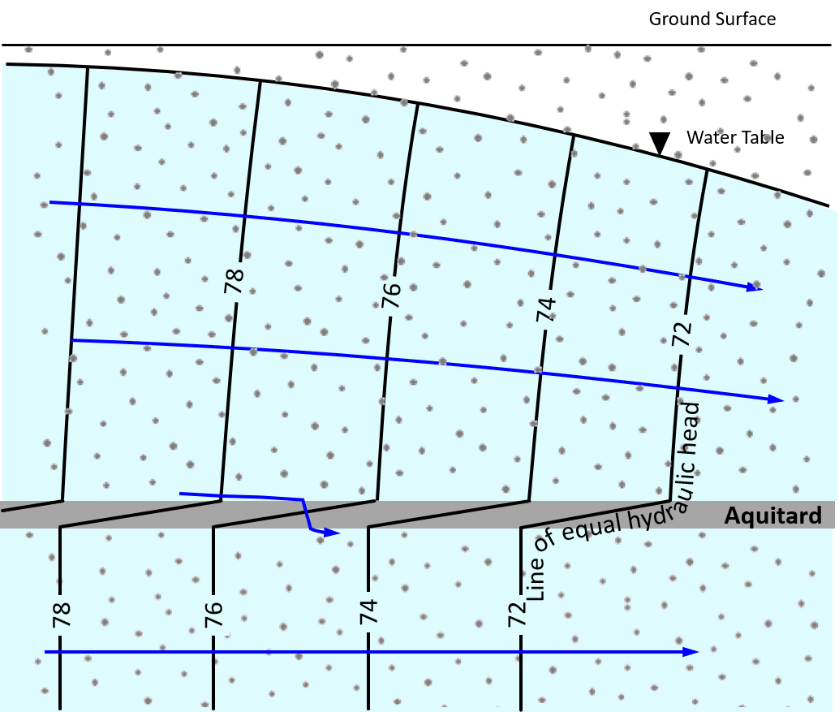 Figure 28 – Potentiometric contour lines in an unconfined and confined aquifer separated by an aquitard (Cohen and Cherry, 2020).
Example Problem 10
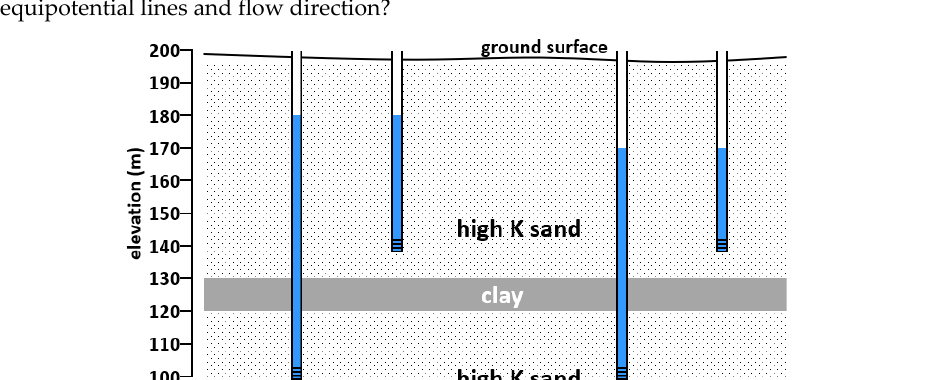
Based on the water level data shown in the schematic, determine which of the options best represents the equipotential lines and flow direction through the two sand layers and the clay aquitard.
Interactive exercise
Simulation: Identification of Equipotential Lines
Analyze the water level data and select the correct diagram. Then experiment with the interactive simulator.
Select the Correct Diagram
Based on the water level data shown above (180m on the left, 170m on the right, in both aquifers), which diagram below best represents the equipotential lines and flow direction?
 Water level data in monitoring wells
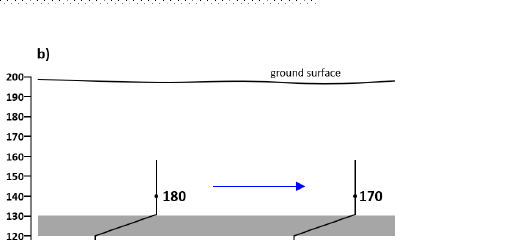
Show solution
Problem 10 Solution
The correct answer is choice “b”: The head at each screened interval is equal to the elevation of the water level in each well. Based on the head data in the sand zones, hydraulic head decreases toward the right, and vertical flow will be restricted due to the aquitard. Accordingly, flow in the sand zones is mainly horizontal, and the potentiometric contours are nearly vertical because flow is orthogonal to potentiometric contours in isotropic media.
- Choice “a” is NOT the correct answer. The head value plotted at each point is correct because it is the elevation of the water in the well. However, this cannot be the correct answer, because the equipotential line does not have an inflection at the top and bottom of the low-K interval.
- Choice “c” CANNOT be the correct answer, because the head values plotted at the points of measurement do not represent hydraulic head. Instead, they represent the height of the water column in each well.
- Choice “d” CANNOT be the correct answer, because the values plotted at the points of measurement do not represent hydraulic head; instead, they are the elevations of the points of measurement.